Category: Human Anatomy
Tags: ECG, Electrocardiogram, Heart, Cardiology, Heart Rhythm, Medical Students, Cardiovascular System
Introduction
An electrocardiogram (ECG or EKG) is a simple and widely used medical test that records the electrical activity of the heart. It helps healthcare professionals understand how the heart is beating and can provide important information about heart rhythm and electrical conduction….
For medical and healthcare students, learning how an ECG works is an important foundation for understanding cardiac physiology and common heart conditions.
In this beginner’s guide, we will explain what an ECG is, how it records the heart’s electrical activity, what the main ECG components represent, and how healthcare professionals use ECGs in clinical practice.
What Is an ECG?
An ECG is a test that records the electrical signals produced by the heart.
Every heartbeat is controlled by electrical impulses. These impulses cause the heart muscle to contract in a coordinated manner, allowing blood to be pumped through the heart and into the circulation.
An ECG detects these electrical changes through electrodes placed on the skin and displays them as a waveform.
The test is:
- Non-invasive
- Usually painless
- Relatively quick
- Commonly performed in hospitals and clinics
How Does the Heart Produce Electrical Signals?
The heartbeat is controlled by a specialized electrical conduction system.
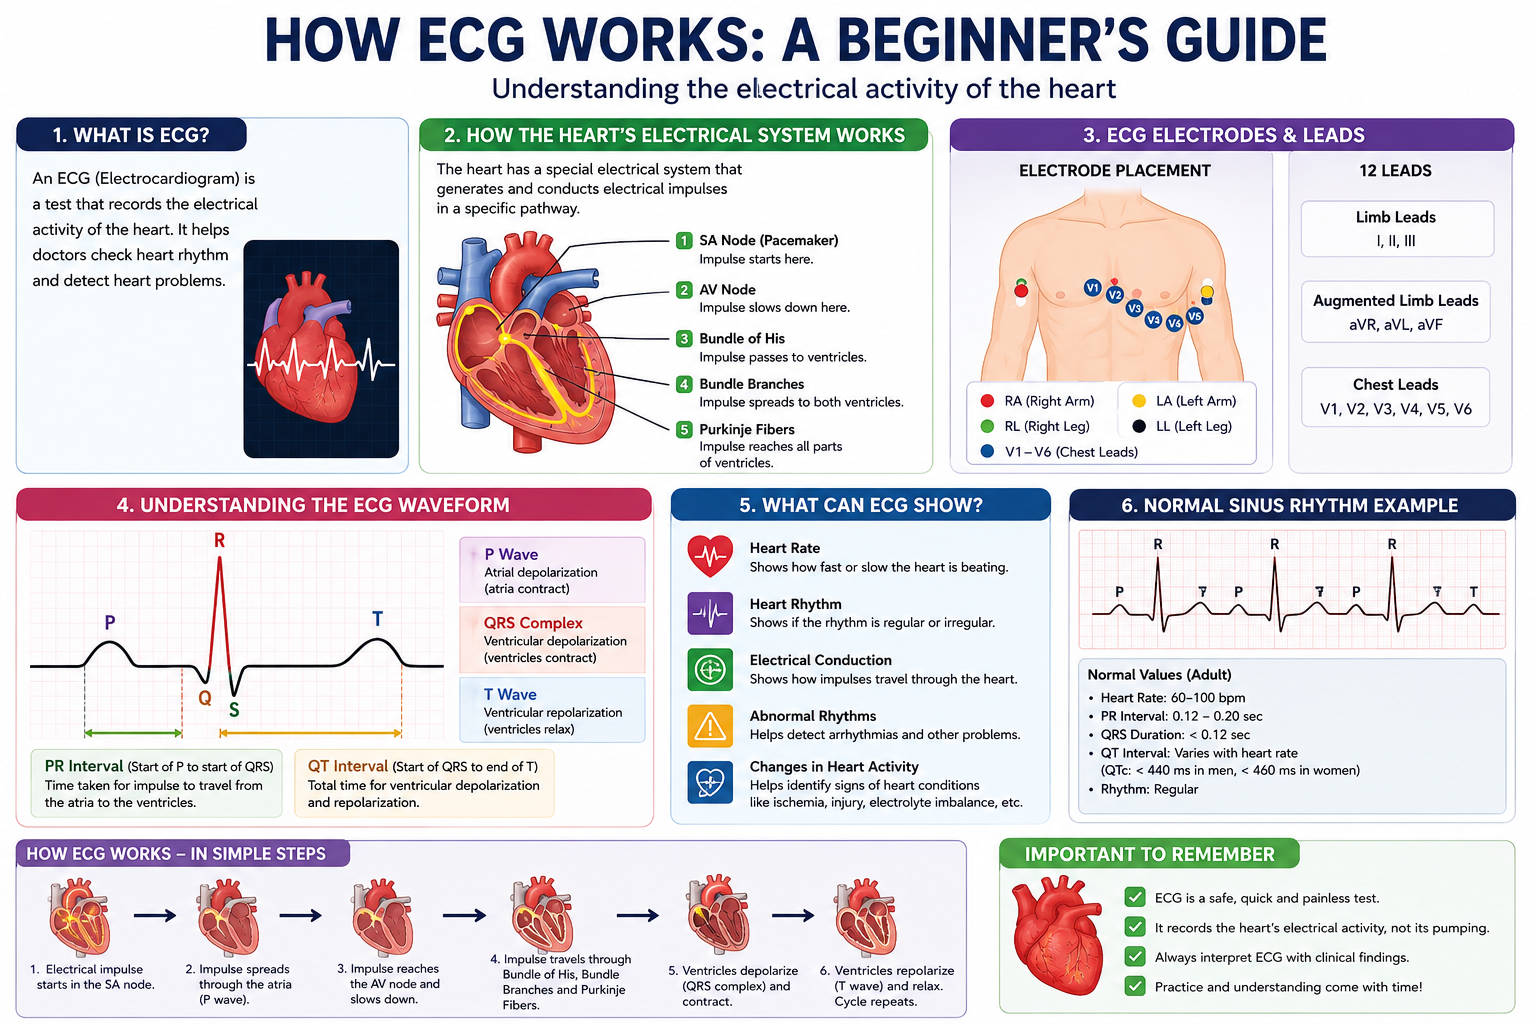
The electrical impulse normally begins in the sinoatrial (SA) node, located in the right atrium.
The signal then travels through the heart in a coordinated sequence:
SA Node → Atria → AV Node → Bundle of His → Bundle Branches → Purkinje Fibers → Ventricles
This electrical activity causes the atria and ventricles to contract in the appropriate sequence.
How Does an ECG Machine Detect the Signal?
The ECG machine does not directly measure the heart’s mechanical pumping action.
Instead, it detects changes in electrical potential on the body’s surface.
Small adhesive electrodes are placed on specific locations on the patient’s chest and limbs. These electrodes detect electrical signals generated by the heart.
The ECG machine processes these signals and displays them as waveforms.
A healthcare professional can then examine the waveform to assess the heart’s electrical activity.
ECG Electrodes
A standard 12-lead ECG uses 10 physical electrodes to create 12 different electrical views, or leads, of the heart.
The electrodes are generally placed on:
Limb Electrodes
Four electrodes are placed on the limbs:
- Right arm
- Left arm
- Right leg
- Left leg
Chest Electrodes
Six chest electrodes are placed at specific locations across the chest:
- V1
- V2
- V3
- V4
- V5
- V6
Together, these electrodes provide different views of the heart’s electrical activity.
What Are ECG Leads?
An ECG lead represents a particular electrical viewpoint of the heart.
The standard 12 leads are:
Limb Leads
- Lead I
- Lead II
- Lead III
Augmented Limb Leads
- aVR
- aVL
- aVF
Chest Leads
- V1
- V2
- V3
- V4
- V5
- V6
Each lead provides information about electrical activity from a different direction.
This allows healthcare professionals to examine different regions of the heart.
Understanding the ECG Waveform
A normal ECG waveform contains several important components.
The most commonly discussed are:
- P wave
- QRS complex
- T wave
- PR interval
- QT interval
Let’s understand them one by one.
P Wave
The P wave represents atrial depolarization.
In simple terms, it reflects the electrical activation of the atria before they contract.
A healthcare professional can examine the P wave to assess aspects of atrial electrical activity.
QRS Complex
The QRS complex represents ventricular depolarization.
It is usually the most prominent part of the ECG waveform.
The QRS complex reflects the electrical activation of the ventricles, which precedes ventricular contraction.
T Wave
The T wave represents ventricular repolarization.
It reflects the electrical recovery of the ventricles after their activation.
The P wave, QRS complex, and T wave together provide a basic framework for understanding the electrical cycle of the heart.
PR Interval
The PR interval represents the time between the beginning of atrial depolarization and the beginning of ventricular depolarization.
It includes the time required for the electrical impulse to travel through the atria and the atrioventricular conduction system.
QT Interval
The QT interval represents the duration of ventricular electrical activity, from ventricular depolarization through ventricular repolarization.
The QT interval is important in clinical ECG interpretation because its duration can vary with heart rate and other factors.
What Can an ECG Show?
An ECG can provide information about several aspects of cardiac electrical activity.
Healthcare professionals may use it to assess:
Heart Rate
The ECG can help determine how quickly the heart is beating.
Heart Rhythm
It can help identify whether the heartbeat follows a regular rhythm.
Electrical Conduction
An ECG can provide information about how electrical impulses travel through the heart.
Abnormal Rhythms
ECG recordings can help identify various cardiac arrhythmias.
Changes in Cardiac Electrical Activity
Certain heart conditions can produce characteristic changes in ECG patterns.
An ECG is only one part of a clinical assessment. Healthcare professionals interpret ECG findings together with symptoms, medical history, physical examination, and other investigations when necessary.
Why Is ECG Important for Medical Students?
ECG interpretation combines concepts from anatomy, physiology, and clinical medicine.
A good starting point for beginners is to understand:
- How the heart’s electrical system works.
- How electrical impulses travel through the heart.
- What the P wave represents.
- What the QRS complex represents.
- What the T wave represents.
- How the 12 ECG leads provide different views of the heart.
- How heart rate and rhythm are assessed.
Once these concepts are clear, students can gradually move toward more advanced ECG interpretation.
Basic ECG Learning Approach
If you are learning ECG for the first time, avoid trying to memorize every abnormal pattern immediately.
A useful learning sequence is:
Step 1: Understand Cardiac Anatomy
Learn the four chambers of the heart and the major blood vessels.
Step 2: Learn Cardiac Electrical Conduction
Understand the pathway:
SA Node → AV Node → Bundle of His → Bundle Branches → Purkinje Fibers
Step 3: Learn the Normal ECG
Understand the:
P Wave → QRS Complex → T Wave
Step 4: Learn Heart Rate and Rhythm
Practice identifying regular and irregular rhythms.
Step 5: Study Common Abnormalities
After understanding a normal ECG, move on to common abnormalities and arrhythmias under appropriate clinical supervision or educational resources.
ECG vs. Echocardiogram
ECG and echocardiography are different tests.
| ECG | Echocardiogram |
|---|---|
| Records electrical activity | Uses ultrasound to create images of the heart |
| Shows electrical rhythm and conduction | Shows heart structure and movement |
| Uses electrodes | Uses an ultrasound transducer |
| Produces waveforms | Produces images/video |
Understanding this difference is useful for medical students because both tests are commonly used in cardiovascular medicine but provide different types of information.
Conclusion
An ECG is an important tool for recording and evaluating the electrical activity of the heart.
For beginners, the most important concepts are the cardiac conduction system, ECG electrodes and leads, P wave, QRS complex, T wave, and basic intervals.
Once these fundamentals are understood, students can progress to more advanced topics such as rhythm interpretation, conduction abnormalities, ischemic changes, and other clinical ECG patterns.
Learning the normal ECG is the first step toward understanding abnormal cardiac rhythms and electrical activity.