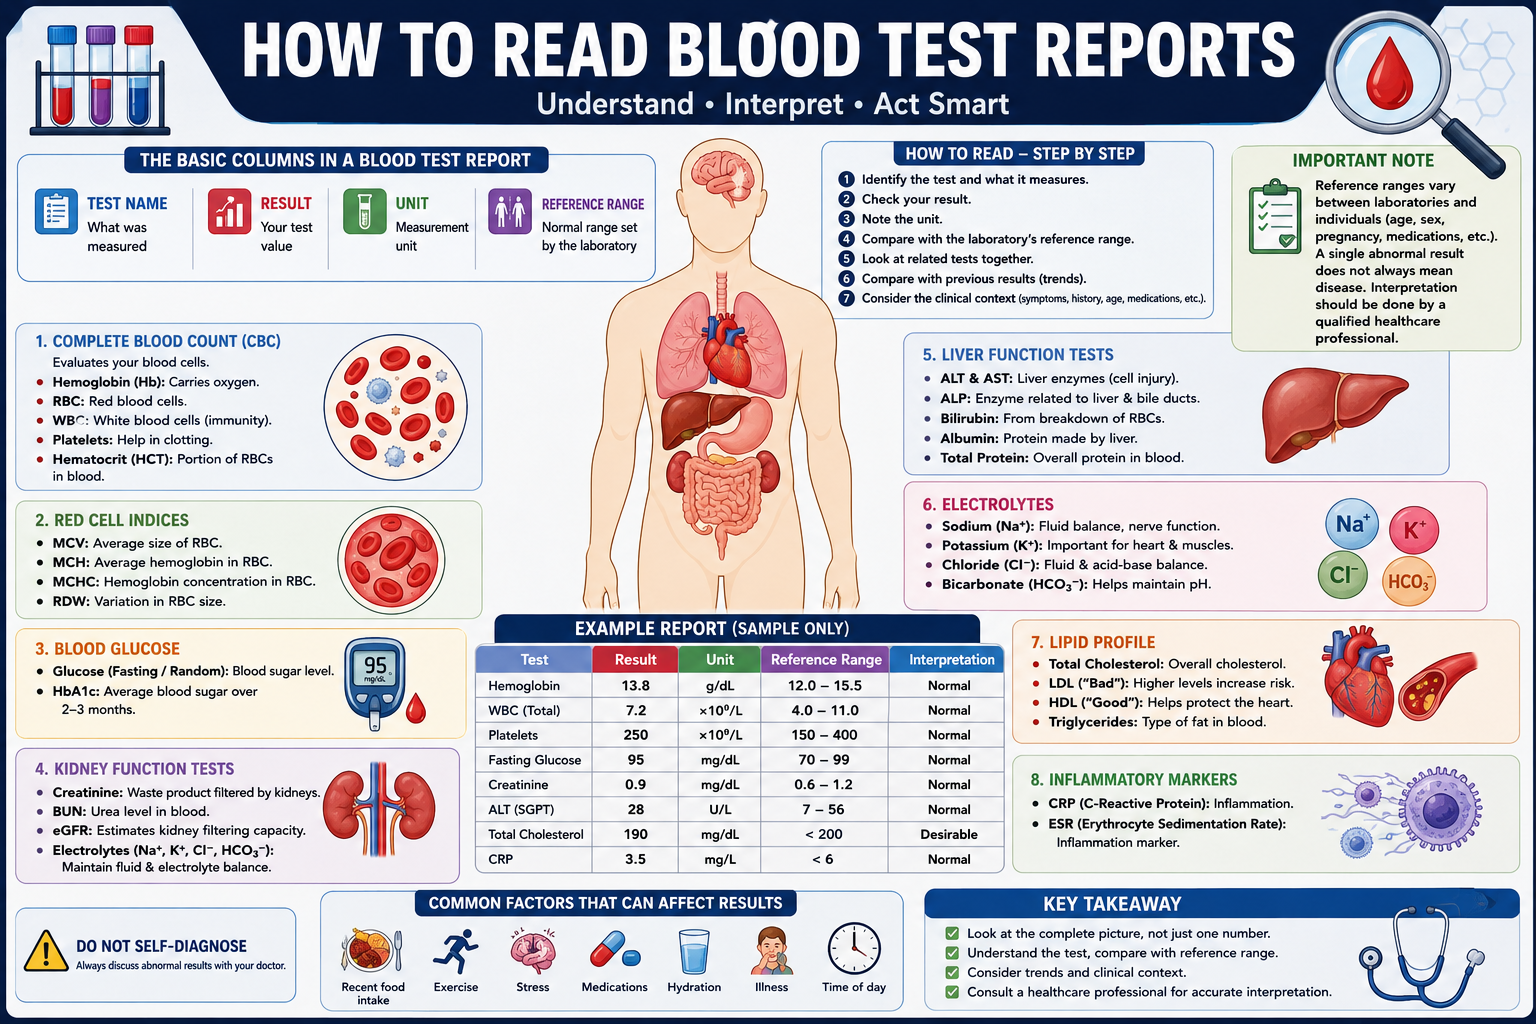
Category: Clinical Skills
Tags: Blood Tests, Laboratory Reports, CBC, Blood Test Interpretation, Medical Students, Healthcare Education, Clinical Skills
Introduction
Blood tests are among the most commonly used investigations in healthcare. They can provide valuable information about a person’s blood cells, organs, metabolism, immune system, and overall health.
For medical and healthcare students, learning how to read a blood test report is an important clinical skill. However, interpreting laboratory results correctly requires more than simply checking whether a number is marked “high” or “low.”
In this beginner-friendly guide, we will look at the common sections of a blood test report, understand what the major tests generally indicate, and learn how to approach laboratory results systematically.
Important: Reference ranges vary between laboratories and may depend on age, sex, pregnancy, medications, medical history, and testing methods. A single abnormal result does not necessarily mean that a person has a disease. Clinical interpretation should be performed by a qualified healthcare professional.
What Is a Blood Test?
A blood test involves collecting a sample of blood and analyzing it in a laboratory.
Depending on the type of test ordered, the sample can provide information about:
- Blood cells
- Blood glucose
- Kidney function
- Liver function
- Electrolytes
- Cholesterol
- Inflammation
- Hormones
- Nutritional markers
- Other disease-related markers
A doctor may order one test or a combination of tests depending on the patient’s symptoms and clinical needs.
Understanding a Blood Test Report
A typical laboratory report may contain several columns.
For example:
| Test | Result | Unit | Reference Range |
|---|---|---|---|
| Hemoglobin | 13.8 | g/dL | Lab-specific |
| WBC | 7.2 | ×10⁹/L | Lab-specific |
| Platelets | 250 | ×10⁹/L | Lab-specific |
| Glucose | 95 | mg/dL | Lab-specific |
The important information includes:
Test Name
This tells you what was measured.
Result
This is the value obtained from the patient’s blood sample.
Unit
Different tests use different measurement units.
Reference Range
This is the range the laboratory uses when interpreting the result.
Always look at the reference range printed on the report, rather than relying on a range from another laboratory.
1. Complete Blood Count (CBC)
A Complete Blood Count (CBC) is one of the most common blood tests.
It provides information about different types of blood cells.
Major components include:
- Red blood cells
- White blood cells
- Hemoglobin
- Hematocrit
- Platelets
- Red-cell indices
Hemoglobin
Hemoglobin is a protein in red blood cells that carries oxygen.
A lower-than-expected hemoglobin level may occur in conditions such as anemia, but the cause requires further evaluation.
Possible causes of anemia include:
- Iron deficiency
- Vitamin deficiencies
- Blood loss
- Chronic diseases
- Other medical conditions
A healthcare professional usually considers hemoglobin together with other CBC values and the patient’s clinical history.
Red Blood Cells
Red blood cells (RBCs) carry oxygen from the lungs to tissues and help transport carbon dioxide back toward the lungs.
The RBC count is interpreted together with hemoglobin, hematocrit, and red-cell indices.
Hematocrit
Hematocrit (HCT) represents the proportion of blood volume occupied by red blood cells.
Changes in hematocrit can occur with conditions affecting red blood cells or blood volume.
White Blood Cells
White blood cells (WBCs) play an important role in the immune system.
Changes in WBC count can occur with many different conditions, including infections, inflammation, medications, and disorders affecting blood cells.
A WBC result should therefore not be interpreted as proof of infection by itself.
Platelets
Platelets help the blood form clots.
A platelet count that is significantly outside the laboratory’s reference range may require further clinical evaluation.
Both low and high platelet counts can have different causes.
2. Red Blood Cell Indices
CBC reports may include several red-cell indices.
MCV
Mean Corpuscular Volume (MCV) describes the average size of red blood cells.
It can help healthcare professionals classify certain types of anemia.
MCH
Mean Corpuscular Hemoglobin (MCH) represents the average amount of hemoglobin in a red blood cell.
MCHC
Mean Corpuscular Hemoglobin Concentration (MCHC) reflects the concentration of hemoglobin within red blood cells.
RDW
Red Cell Distribution Width (RDW) describes variation in the size of red blood cells.
These values are generally interpreted together rather than individually.
3. Blood Glucose
Blood glucose testing measures the amount of glucose (sugar) in the blood.
Depending on the test, glucose may be measured:
- While fasting
- After eating
- As part of a random blood glucose test
- As part of longer-term glucose assessment
HbA1c
HbA1c, also called glycated hemoglobin, provides an estimate of average blood glucose over approximately the previous few months.
It is commonly used in the assessment and monitoring of diabetes.
The interpretation of glucose and HbA1c results depends on the testing context and the individual’s clinical situation.
4. Kidney Function Tests
Blood tests can provide information about kidney function.
Common measurements include:
- Creatinine
- Blood urea nitrogen (BUN), where used
- Estimated glomerular filtration rate (eGFR)
- Electrolytes
Creatinine
Creatinine is a waste product that is removed from the blood by the kidneys.
Changes in creatinine can occur for several reasons, so the result should be interpreted alongside other kidney-related measurements and the patient’s clinical history.
eGFR
Estimated glomerular filtration rate (eGFR) is an estimate of kidney filtration.
It is commonly used to assess kidney function, but it is not a direct measurement and should be interpreted appropriately for the individual patient.
5. Liver Function Tests
Blood tests can also provide information about the liver.
Commonly measured markers include:
- ALT
- AST
- ALP
- Bilirubin
- Albumin
- Total protein
ALT and AST
ALT and AST are enzymes that can increase when cells are injured.
They are often used as part of liver evaluation, although they are not completely specific to the liver.
Bilirubin
Bilirubin is produced during the normal breakdown of red blood cells.
Elevated bilirubin can occur for different reasons, including conditions affecting the liver, bile flow, or red blood cell breakdown.
Albumin
Albumin is a major protein produced by the liver.
Albumin levels can be affected by several conditions and should be interpreted in context.
6. Electrolytes
Electrolytes are minerals that play important roles in fluid balance, nerve function, and muscle function.
Commonly measured electrolytes include:
- Sodium
- Potassium
- Chloride
- Bicarbonate or total CO₂
Sodium
Sodium is important for maintaining fluid balance and normal nerve and muscle function.
Potassium
Potassium is particularly important for muscle and heart function.
Significant abnormalities in potassium can require urgent medical attention depending on the level and clinical situation.
7. Cholesterol and Lipid Profile
A lipid profile may include measurements such as:
- Total cholesterol
- LDL cholesterol
- HDL cholesterol
- Triglycerides
LDL
LDL cholesterol is often described as a cholesterol component associated with increased cardiovascular risk when elevated.
HDL
HDL cholesterol participates in the transport of cholesterol and is one component considered when evaluating cardiovascular risk.
Triglycerides
Triglycerides are a type of fat found in the blood.
Lipid results should be considered together with other cardiovascular risk factors rather than interpreted in isolation.
8. Inflammatory Markers
Some blood tests are used to assess inflammation.
Two commonly known markers are:
- CRP — C-reactive protein
- ESR — erythrocyte sedimentation rate
These tests can indicate that inflammation may be present, but they generally do not identify the specific cause by themselves.
Further clinical evaluation may be necessary.
High and Low Results: What Do They Mean?
Many laboratory reports mark results as:
- High
- Low
- Abnormal
- Outside reference range
However, an abnormal result does not automatically mean that a person has a disease.
For example, a result can be influenced by:
- Recent food intake
- Exercise
- Hydration
- Medications
- Age
- Pregnancy
- Time of day
- Temporary illness
- Laboratory methods
This is why laboratory results should be interpreted alongside the patient’s symptoms, medical history, examination, and other investigations.
How to Read a Blood Test Report Step by Step
A systematic approach can make laboratory reports easier to understand.
Step 1: Identify the Test
First determine what test has been performed.
For example:
CBC → Blood cells
Liver panel → Liver-related markers
Kidney panel → Kidney function and related measurements
Step 2: Look at the Result
Identify the actual value reported by the laboratory.
Step 3: Check the Unit
Make sure you understand which unit is being used.
Different laboratories and countries may use different units.
Step 4: Check the Laboratory’s Reference Range
Compare the result with the reference interval printed on the report.
Do not automatically use a reference range from another website or laboratory.
Step 5: Look at Related Tests
Avoid interpreting one value in isolation.
For example, when assessing anemia, healthcare professionals may consider:
Hemoglobin + Hematocrit + MCV + MCH + RDW
rather than looking only at hemoglobin.
Step 6: Compare With Previous Results
If previous laboratory results are available, looking at the trend over time can sometimes provide more useful information than a single measurement.
Step 7: Consider the Clinical Context
Finally, results need to be considered together with:
- Symptoms
- Medical history
- Physical examination
- Medications
- Other investigations
This is where professional clinical interpretation becomes important.
Example of Reading a CBC
Imagine a report contains:
| Test | Result | Interpretation |
|---|---|---|
| Hemoglobin | 13.5 g/dL | Compare with lab range |
| WBC | 7.0 ×10⁹/L | Compare with lab range |
| Platelets | 250 ×10⁹/L | Compare with lab range |
| MCV | 88 fL | Compare with lab range |
A beginner should not simply label these values as normal or abnormal based on memory.
Instead:
- Check the laboratory’s reference ranges.
- Consider the patient’s age and relevant characteristics.
- Look at related values.
- Consider symptoms and clinical history.
- Discuss unexpected or concerning results with a qualified healthcare professional.
Common Mistakes When Reading Blood Tests
Mistake 1: Looking at One Number
One abnormal value does not necessarily establish a diagnosis.
Mistake 2: Ignoring the Reference Range
Different laboratories may use different methods and reference intervals.
Mistake 3: Searching for a Diagnosis From One Result
Laboratory tests are usually interpreted as part of a larger clinical assessment.
Mistake 4: Ignoring Trends
Changes over time can sometimes be more informative than one isolated result.
Mistake 5: Self-Diagnosing
Blood test results should not be used alone to diagnose or treat a medical condition.
Tips for Medical Students
When learning laboratory medicine:
- Learn what each test measures.
- Understand the physiology behind the result.
- Learn common reasons for high and low values.
- Study related tests together.
- Practice interpreting complete reports rather than isolated numbers.
- Always consider the clinical context.
- Learn the reference ranges used by your institution or laboratory.
- Discuss complex cases with qualified instructors or clinicians.
Conclusion
Learning how to read blood test reports is an important clinical skill for medical, nursing, and other healthcare students.
Start by understanding the test name, result, unit, and laboratory reference range. Then look at related values and consider the patient’s symptoms, history, medications, and previous results.
Common investigations such as the CBC, glucose tests, kidney function tests, liver function tests, electrolyte panels, lipid profiles, and inflammatory markers can provide valuable information when interpreted correctly.
Most importantly, remember that a laboratory result is only one part of the clinical picture. Proper interpretation requires clinical context and, when necessary, evaluation by a qualified healthcare professional.
Leave a Reply